
.svg)


.avif)


.webp)


.webp)

.webp)
.webp)
.webp)

.webp)

.webp)
.webp)


Forget that you’ve already memorized the “coffee's for closers” speech from Glengarry Glen Ross. Building and growing a successful startup sales team is all about metrics.
Successfully managing a team comes down to a lot of number-crunching. This took me by surprise.
It turns out that nearly all of the major responsibilities of a sales leader - everything from setting goals to measuring performance - requires a good understanding of which sales metrics are most important and how to use them.
Since that realization, I’ve worked with dozens of startups to improve their sales teams. I run into confusion over metrics all the time. Most frequently, the team is hamstrung by suboptimal (or, worse, nonexistent) reporting.
That’s a problem for startups, because the clock is ticking. You’re burning runway and you need to get that chart going up and to the right. Fast. So today, I’d like to show you how I use metrics to help startup founders and sales managers...
With each of these sales management subjects, I’ll show you which metrics I use, what their calculations are, and practical examples to help you apply them yourself. Some of these metrics are single-purpose, and others have a wide range of applications, but all of them are exceedingly useful.
If you’re ready to reimagine your sales with metrics, let’s get to the meat of it!
Chomping at the bit to get your sales team optimized? Let’s talk.
Set Your Sales Team’s Goals with ARR
Nearly everything we achieve in sales begins with the goals we’ve set - and that might be an understatement.
Setting expectations, calculating fair compensation, and evaluating performance - basically, all of the ways to use metrics that we’re going to go over in this post - depend on setting the right goals from the start.
Naturally, it’s of great importance that these goals aren’t based on intuition (or desperate wishes), but calculated with as much precision as possible. Precise and achievable goals help pave the way to strong and consistent growth.
ARR (or MRR)
Definition:
Annual Recurring Revenue is the recurring revenue your business generates each year from your existing customers or subscribers [often expressed on a month basis as Monthly Recurring Revenue (MRR)].
Calculation for MRR:
Monthly Average Revenue Per Customer x Total # of Customers = Monthly Recurring Revenue
Calculation for ARR:
MRR x 12 = Annual Recurring Revenue
Explanation:
With the SaaS business model, ARR is the metric we're ultimately trying to grow. It’s a direct measure of your sales momentum, and an ARR chart going up and to the right is a major factor in how investors value your company.
It also serves as the basis for most of your sales goals.
USE CASE - Using ARR to Set Sales Quotas:
To set your sales quotas, begin with your baseline ARR goal.
For example, let’s say ARR is $2.5 millon, and your goal this quarter is to grow ARR by 10%.
That ARR goal is then used to set your sales quota. A 10% increase in ARR is $250,000.
If you have two account executives, that means each rep's quota for the quarter is $125,000. What percent of their quota they actually attain by quarter's end then determines how much commission you'll pay them. (If you’re curious about setting up a compensation plan, we already have that covered, here’s our take on the matter.)
Use LTV & CAC to Set Up Your Sales Team
Successful S.a.a.S. companies build efficient and profitable sales teams. And they don’t achieve that by using motivational speakers or weekly ice-cream socials (though I’m all for free ice-cream).
Doing all that - and doing it well - starts by looking at the ratio between two important metrics: Lifetime Value (LTV) and Customer Acquisition Cost (CAC).
Lifetime Value (LTV)
Definition:
Lifetime value (LTV) is the average profit your startup can expect over the lifetime of each individual customer.
Calculation:
LTV = (Average Revenue Per Customer) X (Gross Margin %) / Churn Rate
Explanation:
This is a crucial number for measuring the health of your startup. LTV too low? That means one or more of these things is true:
- Your ARR per customer is too low (customers are too small).
- You’ve got poor customer retention (ie. customer churn or revenue churn rate too high).
- Or you’ll need to gain efficiencies on the product or servicing side (gross margin is too low).
Customer Lifetime Value also tells you how much you can afford to spend acquiring customers, which brings us to our next metric.
CAC
Definition:
Your Customer Acquisition Cost is everything it costs (marketing spend, sales commissions, etc) to acquire one customer.
Calculation:
CAC = Total Cost of Sales and Marketing / # of Customers Acquired (within the same time period)
Explanation:
This metric is crucial for measuring the efficiency of your sales and marketing. The higher your CAC, the longer it takes you to turn a profit on a customer. Which means the longer you’ll be waiting before you can reinvest that profit in your growth machine.
Using LTV & CAC Together to Build & Optimize Your Sales Team
Okay, now how do we use these two metrics to set up our sales team to most efficiently enable growth? It’s simple. First, we use your LTV to tell you how high your CAC can be if you want to grow efficiently.
As a general rule of thumb, your LTV:CAC ratio should be about 3:1. Any lower than that and you’ll need to acquire customers more efficiently so you can grow faster. If your LTV:CAC is higher than 3:1, that means you’re acquiring customers efficiently - you just need to spend more on sales & marketing.
So, take your LTV and divide it by 3 to get your Target CAC, or how much you should be spending to acquire each customer. The allocation you give to sales specifically can then serve as a guardrail when setting up your team. It’ll tell you things like how many SDRs you should have versus AEs, or how much you can afford to spend on sales commissions.
It’ll also tell you what size of new customers you should be targeting. One of the clients we worked with - a FinTech startup - approached us because they felt that they weren’t getting enough ROI from their sales efforts.
So we did some digging. It turned out that they were targeting companies that were too small… a specific segment of their customer base. Annual contract value (ACV) was under $1k/year - just too small to ever pay off their CAC.
So we set some new rules for their sales team: nobody is allowed to call these types of companies, and we’re upping the minimum pricing to $6k/year. No more selling smaller deals to smaller firms just to get their business. That simple fix helped their LTV:CAC ratio a lot.
CAC Payback - Another Metric That Can Help You Optimize Your Sales Team
Your CAC payback is how long it takes you to earn enough profit to pay off your CAC. Basically, it’s how long it takes until you’re cash flow positive. This is used very similar to your LTV:CAC ratio.
The rule of thumb is to aim for a CAC payback of one year. Any higher than that, and you’re waiting too long to turn a profit. And if it’s shorter? You can probably afford to spend more.
With the FinTech company in our example, targeting the wrong sized companies increased their CAC payback by half a year. We did the math and saw that if they kept going at that rate, they were going to burn their runway fast.
Tracking their sales profitability bought them a lot of time.
Build Your Comp Plan With Average Deal Size and Close Rate
When it comes to motivating and retaining top sales reps, building a killer comp plan is an absolute must. Have a comp plan that’s overly-complicated and rife with difficult-to-reach quotas? That’s a recipe for high turnover and unmotivated reps. On the flip side, a comp plan that works for both the reps and your bottom line can generate great results.
When it comes to building a comp plan, there are 2 key metrics (in addition to your ARR goal) that we use as the basis of our calculations: Average Deal Size and Close Rate. We’ll talk about each below.
Average Deal Size
Definition:
The average ARR your startup would make from each opportunity that enters your sales pipeline.
Calculation:
Average Deal Size = ARR from Opportunities (Total Pipeline) / # of Opportunities
Explanation:
What this metric tells you is how many deals your sales team will need to close in order to meet your startup’s ARR goal.
Close Rate
Definition:
Your close rate shows what percentage of the opportunities that entered your pipeline actually closed to customers.
Calculation:
(# of opportunities / # of successfully closed sales) x 100
Explanation:
Close rate is arguably the most important indicator for measuring how your sales team is doing. A low close rate could indicate problems with meeting quality, AE performance, your sales process, or that you’re targeting the wrong customers.
How to Use These Metrics to Build a Killer Compensation Plan
When combined with your ARR goal, these two startup metrics together can help us figure out exactly how to structure the variable compensation (commissions, sales incentives, etc) in our comp plans.
For SDRs, you do this by working backwards from your ARR goal.
Take your ARR goal and divide it by your Close Rate. This will tell you your Pipeline Goal, or how much pipeline (potential ARR from opportunities) you’ll need to get into your sales funnel to hit your ARR goal.
Then divide your Pipeline Goal by your Average Deal Size to get the total number of qualified opportunities you’ll need to hit your target. This number then becomes your SDR’s opportunity quota, which forms the basis of their variable compensation.
For AEs, compensation is a lot more simple - they’re usually just taking a percentage of the Average Deal Size as their commission.
Forecasting the Future with Committed Deals
Forecasting sales is all about estimating the likelihood that you’ll hit your ARR target. If things aren’t looking good, you can jump in and make some changes.
Forecasting is really only about one metric - Committed Deals.
Committed Deals
Definition:
A committed deal is an opportunity which is estimated to have a 90% chance of going through - in theory only derailed by something catastrophic and unforeseen.
Explanation:
There isn’t a specific calculation for committed deals, but you have to be certain that all salespeople are categorizing a deal as “committed” under the exact same criteria.
Recommended Criteria:
The best way to ensure the most accurate possible reporting is to include both objective and subjective cases.
Objective: Set a point in the sales process past which most deals are considered “committed”. For most companies, this is going to be prospects to whom you’ve sent the final contract.
Subjective: Now, of those contracts, some of them may close this month, some may take longer, and some may be doubtful to close at all for one reason or another. This is your AE’s judgement. At the end of the day, it’s up to them to mark deals as committed for a particular time frame based on what they know about the prospect.
Use Case - Intercept Problems in the Sales Process:
Knowing where you’re going to land in a given quarter (red or black), and helps you plan your strategy for the next one.
For example, if the company from our previous use case has 25 committed deals early in the quarter, with a closed-deal quota of 17, they are doing very well, and might consider expanding their sales team.
If, however, 10 of those deals end up falling through, their “slip rate” would be a shocking 40%, and it would require a thorough review of the “committed” criteria (i.e what the heck were those AE’s doing?) and autopsy of the sales process.
You don’t use this metric to “know the future”, but to see opportunities and problems while you still have time to act on them.
Measure Your Prospecting with Activities, Demos Booked, and SAOs
As the all-important first stage of your sales funnel, prospecting builds your sales pipeline. It’s the fuel that drives your ARR growth.
But only if it is effective prospecting.
That means as little wasted time and effort as possible, with the maximum number of opportunities booked and sales won from your list. Obviously, this doesn’t happen on it’s own.
Effective prospecting begins with tracking. Specifically, tracking your Activities, Demos Booked, and SAOs. Here’s why I chose these metrics, and how to use them in conjunction:
Activities
Definition:
Activities are the measurable actions taken by your sales reps. To put it simply, this is the actual prospecting and sales work your reps are doing.
Activities are best tracked in both performance (Meetings Booked & Conversion Rate) and volume. For example:
Activity Tracking Table: Performance + Volume
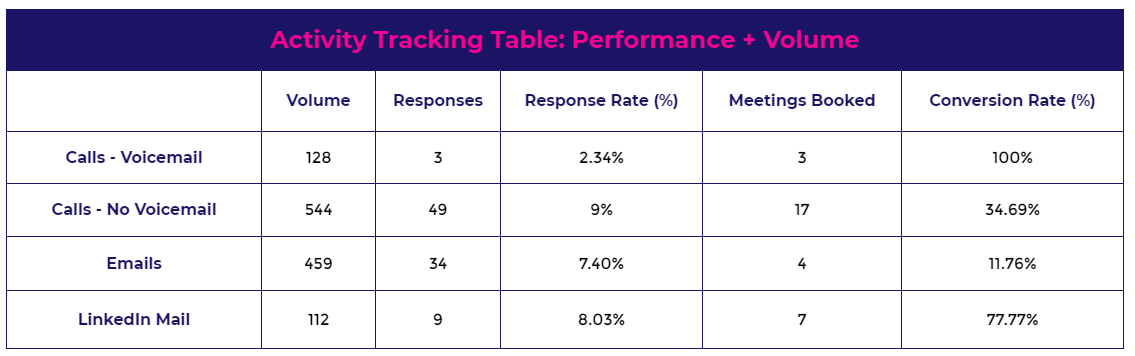
Activity metrics require diligent recording. Having your sales team follow protocols for the reporting of this important information will make it that much easier to track.
Explanation:
Tracking these activities gives you an idea of how much work your team is doing to get in contact with your prospects, and, frankly, how good your reps are at turning those contacts into scheduled meetings (the next metric we’ll talk about).
Use Case - Refining Your Sales Strategy:
Tracking activity and response is so important because it tells you a lot about which channels work and which channels don’t..
Here’s an example:
One of the clients who brought us in was prospecting with phone calls, emails, and LinkedIn. They were making 120 calls and connecting 2 people a day. This resulted in only 2-3 demos per week. I’m a big cold-calling guy, and I was still shocked at this strategy. That’s a lot of calls for just 2 connects a day!
The issue turned out to be their data. They really just needed better numbers (direct dials versus general company number) to call. But those don’t just fall out of the sky. So in the meantime, we started them on a LinkedIn and email-focused strategy. When our rep switched tactics, he started booking 8-10 demos a week.
The lesson? If cold-calls aren’t effective, STOP COLD CALLING. Same with any other activity.
(If you’re wondering how we decipher SDR and sales metrics and decide where to make meaningful adjustments, check out this video!
Demos Scheduled
Definition:
The number of meetings your sales team has scheduled in a certain time frame.
Explanation:
This metric helps specifically benchmark & measure the prospecting phase of your sales funnel. How well is your SDR or AE (if full funnel) team converting the leads they’re targeting? How many of these become Sales Accepted Opportunities?
Tracking the number of meetings you have scheduled helps track the efficacy of your sales team. Pair this with the number of SAOs to see how efficiently your prospecting system is operating.
Sales Accepted Opportunities (SAOs)
Definition:
A sales accepted opportunity is a potential customer that has been contacted and verified by sales as a deal with a high probability of closing.
Explanation:
Tracking SAOs helps you determine the health of your sales pipeline. It tells you how effective your prospecting efforts are at generating quality meetings that actually have a high probability of closing.
Use Case - Measure Your Prospecting Performance Using Activities, Demos, and SAOs:
Activities, meetings, and SAOs are a reflection of the work that’s gone into building the sales pipeline. Paying attention to these metrics could help you optimize your reps’ time and focus them on the channels that are yielding better results.
For example, let’s say your reps are making tons of phone calls but just aren’t able to book enough meetings.
While you’re digging through the data, you notice that meetings booked through LinkedIn have a very high conversion rate, and fuels a high proportion of your SAOs, despite having a low volume of activity.
In this instance, shifting your reps’ focus from phone to social media would likely yield really good results.
These metrics also allow you to keep a finger on the pulse and respond to issues quickly.
A simple example might be noticing that your reps are making way less calls than they usually do. This is going to lead to less meetings booked, which means less SAOs, which ultimately means less sales in the following months. Not good. So to avoid this, you can respond by quickly getting to the root of the problem and helping reps get their call volume back up.
Measure Sales Team Performance with Closed Deals and Average Deal Size
How well is your sales team driving revenue? This is the million dollar question (perhaps billion if you’re selling into the enterprise). Keeping track of a few KPIs can give you a clear window into how individual reps are performing, which allows you to replicate the habits and tricks of your highest performers across the whole team.
Two of the most helpful metrics for this specific use case are Closed Deals and Average Deal Size (which we’ve used once before already.)
Closed Deals
Definition:
The number of deals closed by your sales team.
Calculation:
# of all deals closed generated in a given period (i.e 12 months)
Explanation:
This is the ultimate accountability metric.
Closed deals, in essence, means the money that you will make - and is the direct result of how your team is performing.
Average Deal Size
Nope, that’s not deja-vu, we used this to help us calculate compensation. Now it’s back for an encore.
Here’s its calculation again:
Calculation:
Average Deal Size = ARR from Opportunities (Total Pipeline) / # of Opportunities
How To Use Closed Deals and Average Deal Size to Measure Sales Performance
Pairing average deal size and closed deals helps you dissect the ARR generated by your sales team. Not only do these metrics give you a look at the breakdown of sales earnings, they also can shed light on which strategies are working and which aren’t.
Let’s say your average deal size is $50,000. With a quota of $2.5 million for the quarter, you know you’ve got to get your two-person sales team to 50 deals.
Your senior rep’s average deal size is $75,000. They’ve closed 15 deals in the last quarter (total sales: $1,125,000) - exceeding their $1 million quota.
However, your junior rep has been going after smaller accounts because they sell easier and close faster than the big deals. Their average sale is quite low, just $25,000, but they’ve closed 60 deals (total sales: $1,500,000).
Now, both reps have exceeded their quotas, and there’s nothing to worry about revenue-wise, but now you know just how effective targeting smaller deals can be for your business ($375,000 more effective, to be precise).
Optimize Your Sales Process with Close Rate and Time-in-Stage
Successful startup sales teams regularly optimize their sales process - using data to look for the holes that customers slip through, and trying to plug them. Tightening up your tactics allows you to use your resources more efficiently, and generate a higher amount of revenue with less wasted expenditure.
To do this, I like to compare Close Rate and Time-in-Stage.
Close Rate
Calculation:
(# of opportunities / # of successfully closed sales) x 100
Time In Stage
Definition:
The length of time a prospect spends in a current sales stage.
Calculation:
Time in Stage = # of days prospect remained in X Stage
Explanation:
Time-in-stage tells you the time which prospects generally take to move through your sales funnel, and helps you identify stages of the sales process to improve.
What you set as “stages” may depend on your business structure, typically these might be “Meeting” or “Contract Out”.
You can also look at this in terms of the stage conversion rate - or the % of deals that moved from one stage to the next.
How to Use TiS and Close Rate to Optimize Your Sales Process
Time in stage is endlessly helpful for pinpointing weaknesses in your sales process - ie. stages where your close rate plummets. Once you’ve identified problem areas, you can shore up your sales process appropriately.
Let’s say you know it takes an average 40 days for a prospect to move from the meeting to the contract stage. Close rate on these contracts stays steady for almost another month. After 65 days, however, the close rate on prospects drops to 5%.
This tells us that you really want to have sales get that contract sent well before that 65 day mark.
This indicates you should implement strategies to help jumpstart the sales process and prevent prospects from languishing in this stage.
Conclusion
I’ve seen early-stage startups of all kinds struggle with their sales, and it’s always a huge source of frustration and stress. There’s so much responsibility riding on the sales team - even small setbacks can have real consequences.
It’s because startups have unique business pressures - which generally boil down to:
- Extremely limited staff.
- Very limited resources.
- Rapidly disappearing runway.
- Lots of expectations to live up to.
It’s in this pressure cooker of a business environment that “managing by the metrics” really makes a difference. You don’t have the time or resources to get it wrong.
If you need help building, launching, or optimizing your startup's sales team, schedule a consultation! I'll analyze your data, then provide you with actionable tips you can use to immediately improve your sales team.
