
.svg)


.avif)


.webp)


.webp)

.webp)
.webp)
.webp)

.webp)

.webp)
.webp)


What is Revenue Per Lead and Why is it Important?
Every business is different and so are their marketing channels. With so many different marketing channels, each business has its unique way of generating leads that they attempt to convert into paying customers. Revenue per lead (RPL) is a metric used by marketing and sales leaders to determine how much revenue each lead is worth to the organization.
Revenue per lead is useful for determining the answer to two important questions.
How much can I pay per lead?
How much you can pay per lead is what we call, willingness to pay (WTP). Revenue per lead is a good way to determine how much you can, or cannot, pay per lead. For example, if we calculate that each lead will bring in $500 of revenue, then you definitely do not want to spend more than $500 to acquire a lead, because that would put you at a loss. Calculating the RPL will enable you to find out how much you are able to spend on your lead acquisition efforts.
How efficient is my sales acquisition process?
Efficiency is important, and revenue per lead can help you determine how efficient your sales acquisition process is. This takes into account the quality of your leads, and its effectiveness by analyzing revenue per lead by the campaign, by type, average deal size, and those closure rates.
Before we dive into the calculation, let’s talk about the mistakes people make when calculating revenue per lead.
The most common mistake when calculating revenue per lead.
“Simple... It’s your Revenue divided by your number of leads! Right?”
Well…yes.., but it’s actually not that simple.
Each company has different sources of leads and they may even run different campaigns within each source and even target different personas. This complicates things quickly.
You can of course calculate revenue per lead in the simple way mentioned above, but blended analyses never tell the real story. This can lead to poor decision making and we suggest you avoid that!
There are three things to consider when calculating revenue per lead. Lead source, lead campaign, and personas.
Lead Sources
There are multiple sources of leads, such as inbound leads, webinars, referrals, demo requests, cold data, etc. Each source can generate leads for your business but some are more predictable than others.
For example, if you run a webinar you may generate 100 leads. This is great! You may find yourself wanting to run webinars every week! The problem is that the topic of the webinar changes and the interest from the audience may change as well, for better or for worse.
To calculate revenue per lead solely based on the lead source would be a mistake, you must also consider the campaign.
Lead Campaigns
Running lead campaigns is an important part of lead generation. Sometimes, a lead campaign is a lead source all on its own. Other times, the lead campaign is one of many supporting a specific channel.
Let’s stick with our webinar example. If “Webinar” is a lead source, the topic of each webinar would be the campaign. “Topic 1,” “Topic 2,” and “Topic 3” will each produce different results. That’s why it’s important when calculating revenue per lead, to include the campaign names. By doing this you can have a clear picture of the effectiveness of each specific campaign, as well as the channel as a whole.
Action tip: Separate your revenue per lead analysis by lead source and lead campaign.
The Correct Way to Calculate Revenue Per Lead
Calculating revenue per lead can be complicated if you have a lot of lead sources. Here are some common lead sources.
- Marketing Ad Campaigns (various channels)
- Data providers (like Zoominfo)
- Internal Marketing Efforts (Website, Demo, Webinars, Podcast, PR)
- Conferences Exhibition and Events
- Referral from current/past customers
- Philanthropy efforts
Each of these leads has different “warmth” levels, which will determine the likelihood of purchasing a solution. The “warmer” the prospect, the more likely they will buy. “Warmth” here can be understood by their willingness to have a meeting - Not necessarily the willingness to purchase the product. But because their warmth is different, we need to separate their Revenue per lead for each lead type.
Let’s take a look at the following table as an example.
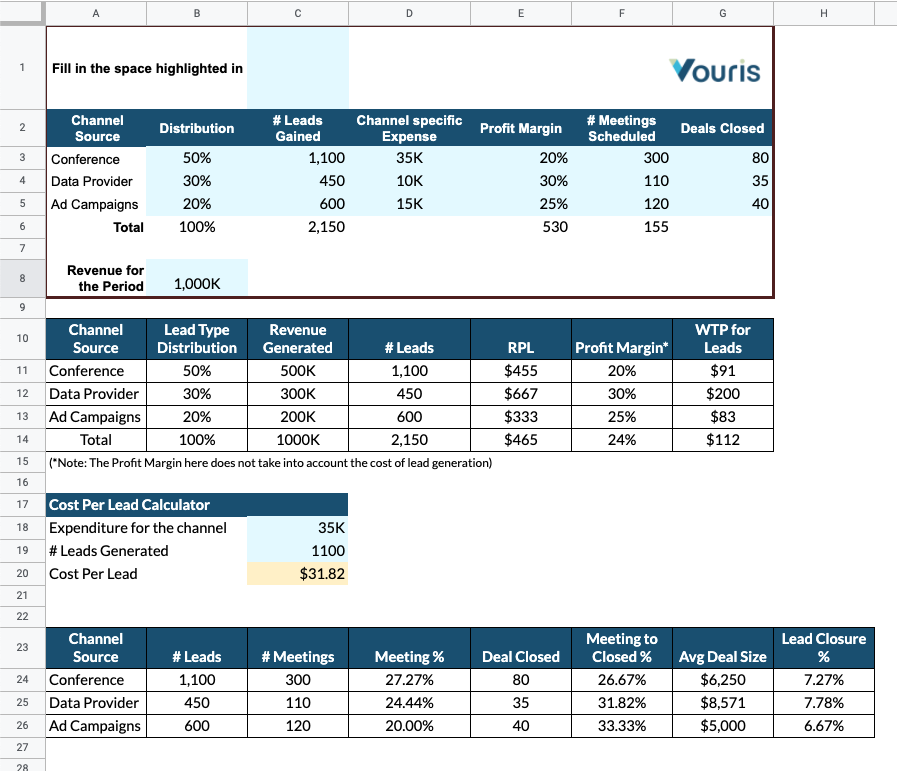
Revenue for the period: $1,000,000

Figure B
The first 3 columns simply tell you information about how much revenue was generated by what source, based on the distribution % on Column 2. Each source of lead generation created a different number of leads. For example, Conference generated 1,100 leads, while Ad campaigns generated 600. By using these numbers, we can calculate our RPL that is given by the following formula:
RPL(β) = Revenue generated (β) / # Leads (β)
“β” is used to describe “any lead source”
If we had used the total number as we said in the beginning, this would have given us a number that would not make sense for any channel. The total number is skewed since it does not take into account the cost and efforts individually, as well as the weight of distribution associated with each channel.
Action Tip: Use the formula above to calculate the revenue per lead, per lead source.
Calculating the Willingness to Pay for a sales lead
Now that we have RPL by source, we can easily calculate the WTP for a sales lead. This will also answer the question “How much you can afford to pay for a sales lead.”
As you can see from the last two columns, the Profit margin is different among lead sources. The Profit Margin tells you how much profit is left after deducting all the cost of goods/services sold and the operations associated with it.
- Conferences, for example, come with a high cost of setting it up, coordinating travels, and paying for travel expenses, thus its cost is generally higher.
- Ad Campaigns require you to pay for clicks or views and may not be consistently successful across all campaigns.
- Data Provider (like Zoominfo) is the lowest since you’re obtaining data from a fixed price.
With those in mind, multiplying RPL to Profit Margin gives us WTP per lead. This number is a reference for the maximum price you’d be willing to pay in order to stay positive on the profit & loss statement for that lead generating channel. Any cost to generate leads above that threshold would put that channel or project at a loss.
As an example, per our table above, Data Provider yielded $667 per lead. With a 30% profit margin, the Willingness to Pay is calculated as $667*30% = $200. This is also your breakeven point. Any amount paid in excess of this number would only put you in a profit loss, more on that in the next section...
Action tip: Calculate your willingness to pay based on the revenue per lead number you came to.
What is Cost per lead (CPL) and how do you calculate it?
Cost per lead (CPL) helps you understand what you paid to obtain a certain set of leads that were generated by its source efforts.
CPL = Total expenditure of that channel / # of leads obtained
(Some companies also used “Qualified Leads” for this calculation)
For example, let’s take our Conference number from the table in say Denver, and you spent $20k in the conference, $10k in travel expenses and $5k in other expenses and that generated you 1,100 leads, your CPL is calculated by $35k/1100 = $31 per lead ( which is lower than the WTP of $91.)
Action Tip: Compare your cost per lead with your willingness to pay and make sure the CPL is the lower number.
Determining the effectiveness of lead acquisition
Now let’s assume we’re back in the office and all the leads are given to the sales team. It’s now time for the team to start prospecting, setting meetings, demos, and try to close the sales.
The following table shows the results of prospect engagement.

Let’s talk about the metrics here one by one.
- # Meetings is the number of meetings scheduled from the leads
- Meeting % describes the percentage of meetings scheduled against the # of leads. This percentage normally describes the engagement of leads, in terms of willingness to have a further conversation.
- Deal Closed tells us how many sales were made as a result of those meetings.
- Meeting to Closed % refers to what percent of those scheduled meetings resulted in closed deals. This is often used to determine the quality of the leads because unqualified meetings could not be converted to customers.
- Average Deal Size is the average revenue brought in by each customer.
- Lead Closure % is ‘Meeting %’ multiplied by ‘Meeting to Closed %’ and explains the overall quality of the leads.
These metrics are important to marketing and sales leaders as they utilize these metrics and try to improve each step of the engagement process.
Average Deal Size, for example, can further tell sales leaders which channels are generating more revenue per lead.
In Figure B, we see that the Data Provider generated a higher deal size than the rest. This may signal to management to put more focus here since it will earn them more revenue and higher profit.
Keep in mind, there are a ton of variables involved across marketing and sales. It’s impossible to account for everything. In this article, we give an overview of what has worked very well for us. Keep in mind that your own context matters and should guide any analysis you conduct.
Action Tip: Look at all of your calculations and ask yourself, “is our lead acquisition effective?”
Using Financial Models to Calculate Revenue Per Lead
Calculating Revenue Per Lead (RPL) within financial models involves dividing the total revenue generated from a set of leads by the total number of leads acquired over the same period. This metric helps businesses understand the value each lead brings to the company, guiding marketing and sales strategies to optimize for higher revenue generation. For example, if a company generates $100,000 in revenue from 1,000 leads, the RPL would be $100 ($100,000 / 1,000 leads).
To enhance the precision of the RPL calculation, segment your leads by source, campaign, or customer demographics to identify which channels are most profitable. For instance, if a digital marketing campaign generates $50,000 from 400 leads, the RPL for this campaign is $125, higher than the overall RPL. This segmentation allows businesses to allocate resources more effectively, focusing on high-yield activities. Additionally, incorporating conversion rates into the model can refine the analysis further, by distinguishing between the quality of leads from different sources and adjusting strategies accordingly.
Our template
Action Steps
- Action tip: Separate your revenue per lead analysis by lead source, lead campaign, and persona (optional).
- Action Tip: Use the formula above to calculate the revenue per lead, per lead source.
- Action Tip: Compare your cost per lead with your willingness to pay and make sure the CPL is the lower number.
